

Hello and welcome to a new educational segment. For any new readers, welcome! In this newsletter I discuss levels, scenarios and market analysis for the S&P500 market. Checkout what the daily Trade Plan is about here
Today I am releasing my first educational piece on how to identify levels.
*For an optimal experience, please view from a laptop/desktop device on the Substack website.
How to identify and trade levels
The purpose of this exercise is to learn to identify both minor and major support and resistance levels. I take you step by step starting from a clean chart and show you the process I use to identify levels and explain how I approach trading around these levels.
Prerequisites
This post is geared towards traders familiar with the auction market theory and have a strong foundation in the Market Profile technique
If these are foreign concepts to you, or for a primer, I highly recommend Markets in Profile by Jim Dalton.
 eBook : Dalton, James F., Dalton, Robert B., Jones, Eric T.: Kindle Store")
I highly recommend any content coming from Jim Dalton. While my trading strategy differs dramatically from Dalton, the concepts that he teaches are timeless.
Identifying Levels
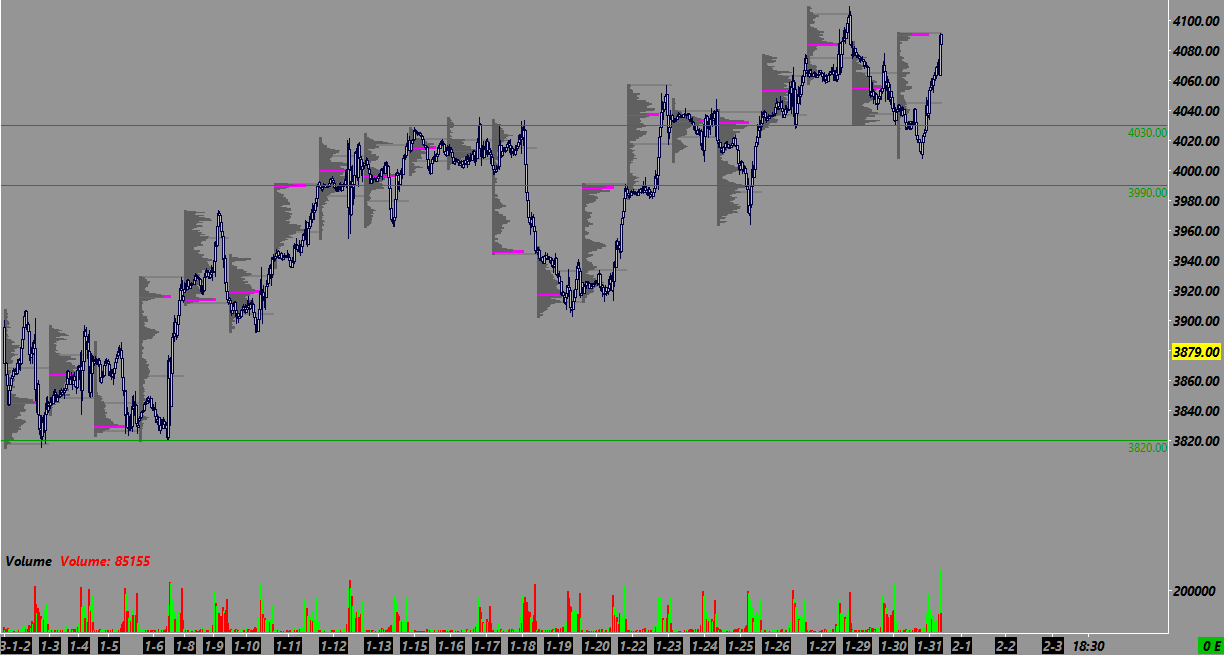
I will be starting from the first day of trading 1/3/23 and go until 1/31/23.
I will ignore all previous context and all risk events during this period and look at price action and levels in a vacuum.
We will begin by identifying levels on the 30 minute chart (30 minute is equivalent to the standard TPO chart). We will simply identify levels that acted as obvious support or resistance.
Now that we have identified the key levels on the daily time frame, we will drill down into the one minute chart and I will start with the first day of January, 1/3.
1/3/23
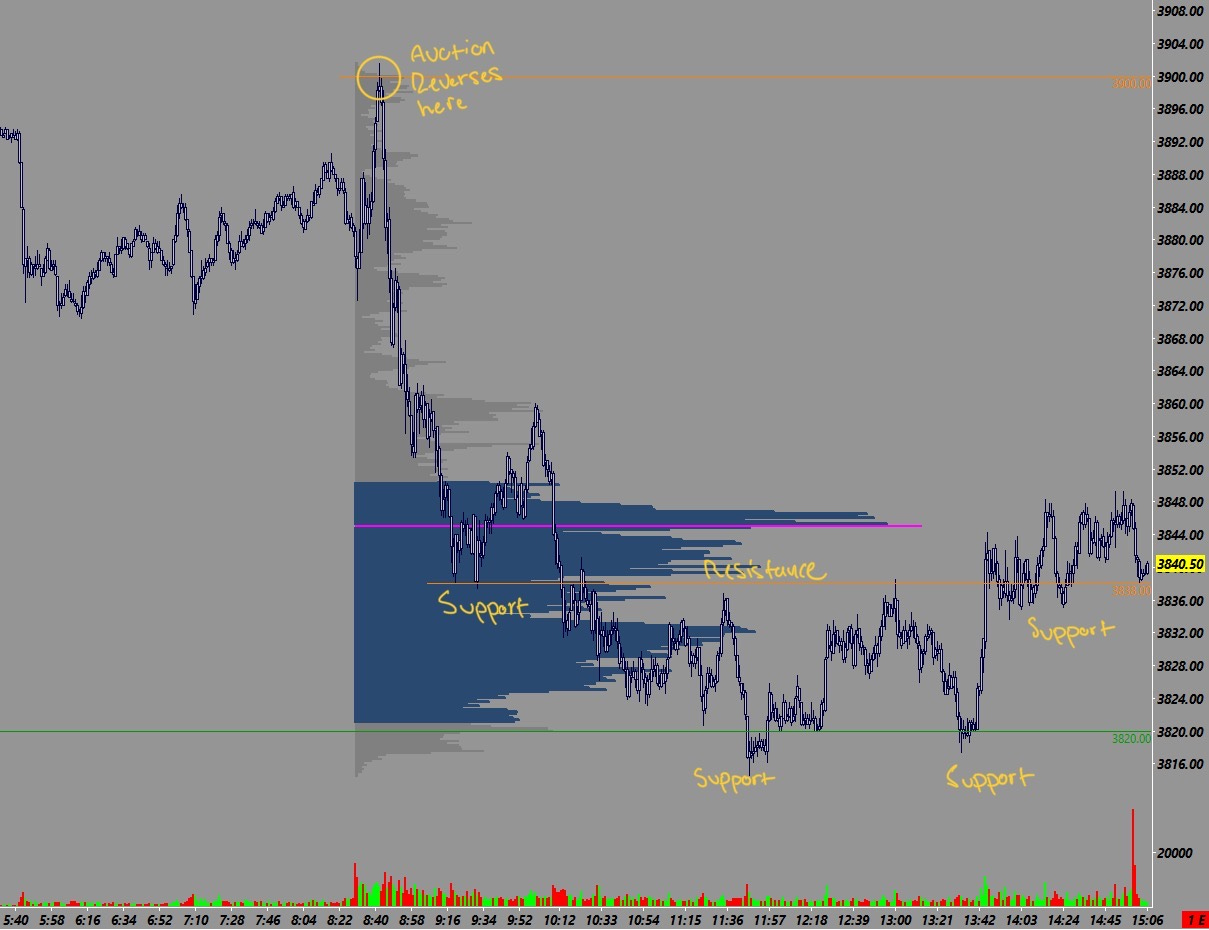
You can clearly see 3938 was an important level during this session. This level acted as support in the morning, resistance in the afternoon, then support again at the end of the day.
After seeing this type of profile, I am looking to use this 3938 as my "pivot" level.
The following session was FOMC day, but I am ignoring that and looking at price action in a vacuum for educational purposes.
At the open of the following session 1/4, we opened in the middle of the two references we identified from the previous session so there was not much opportunity for this system.

However after the first hour or so the market turned down and we tested the pivot level. After a successful test and hold of this level, there was plenty of opportunity to get long for multiple overhead targets. The logical targets to look for here would be the “
”origin” level, hod, then pHOD.
1/5/23
The previous session saw a test and hold of what should be considered a “minor” support level at 3938.
The level I identified as the “pivot” for this session to come is 3876. The chart below shows how price bounced around this level before the FOMC and how this level acted as firm resistance after the FOMC. This level also loosely coincides with the previous day value area high.
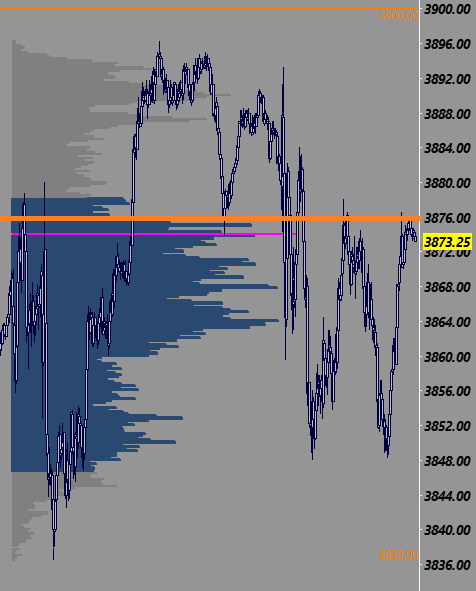
Therefore this would be my “pivot” level for the next day, leaning bullish above it, targeting 3900 and bearish below it looking for a re-test of 3938 support.
Here is my actual trading plan for this session
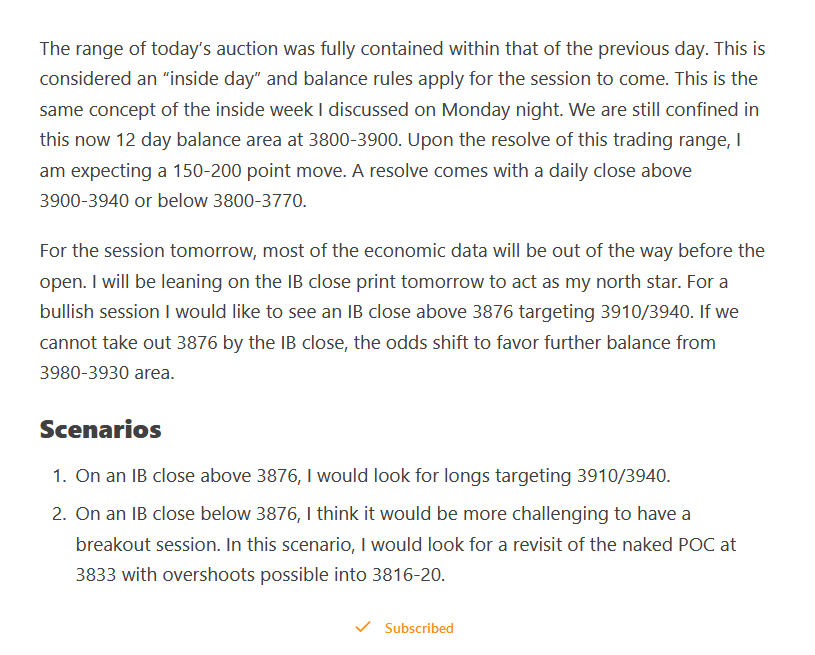
3876 did in fact act as resistance and the bulk of this move carried out during the overnight session
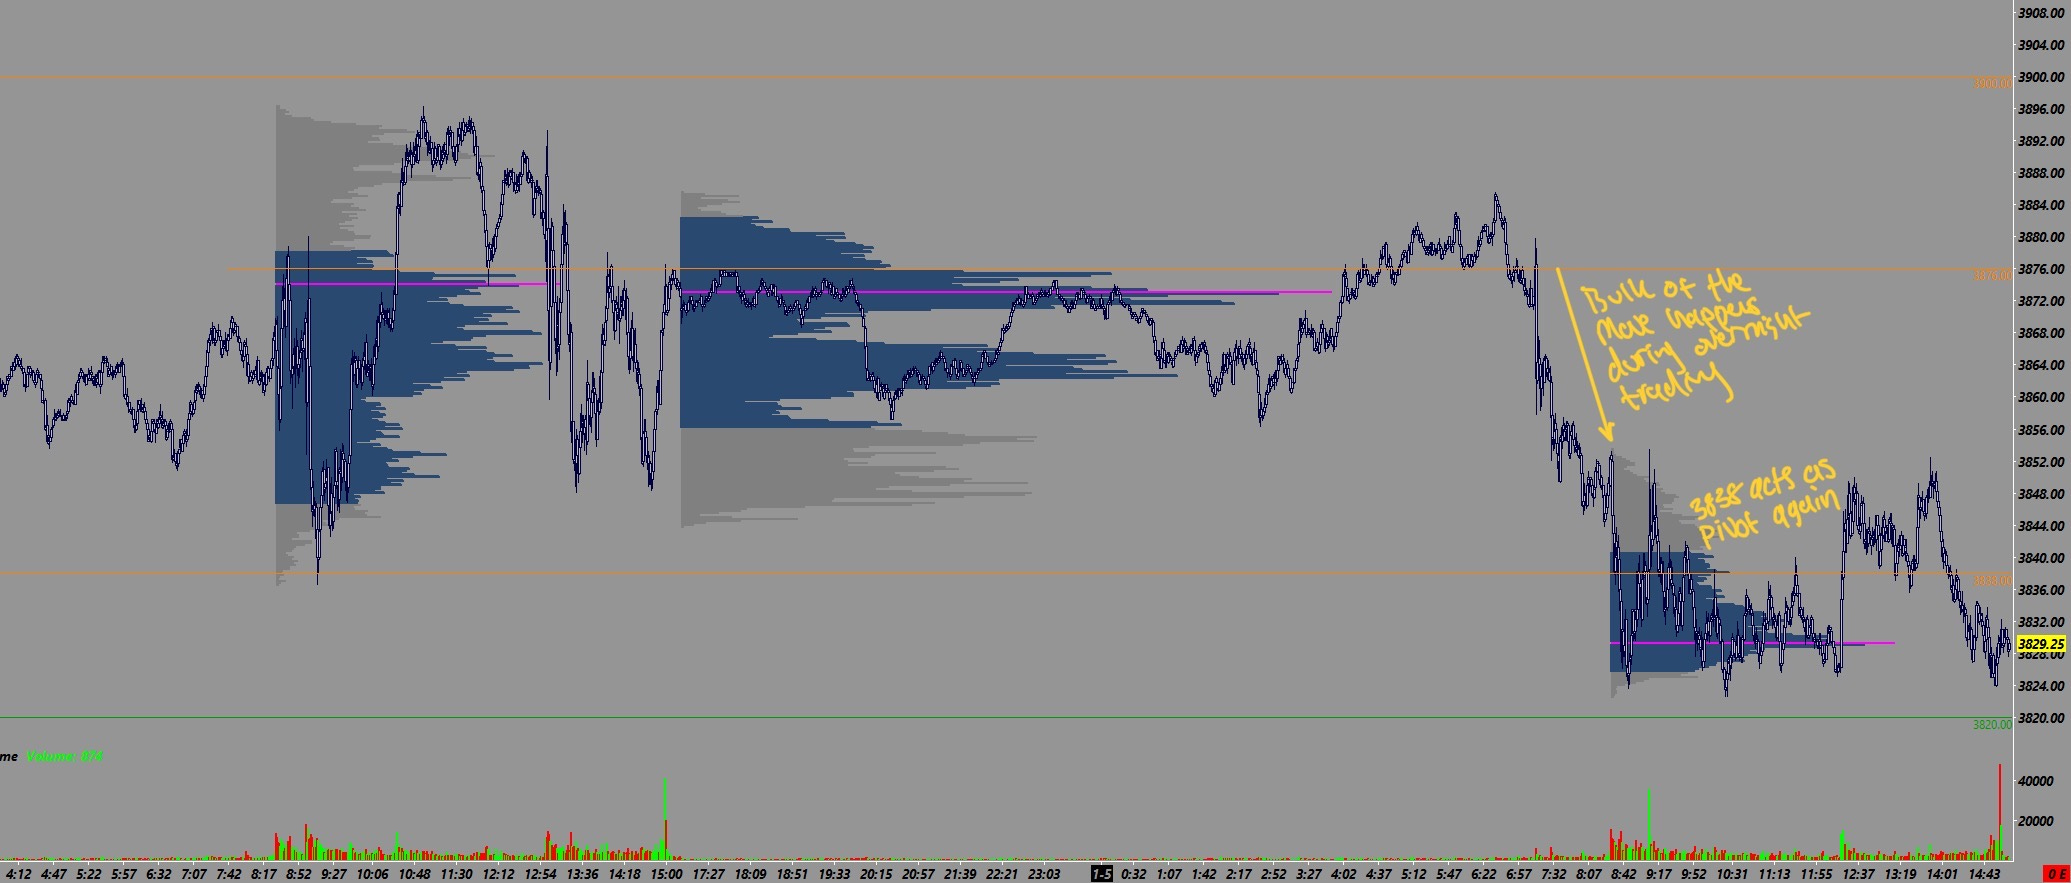
While the trading opportunities during regular trading hours were limited on this day, it demonstrates how price fluctuates between these support and resistance levels. Notice how 3938, the pivot level identified a few trading sessions back, acted as the pivot again today.
The following session was a NFP and unemployment report.
1/6/23
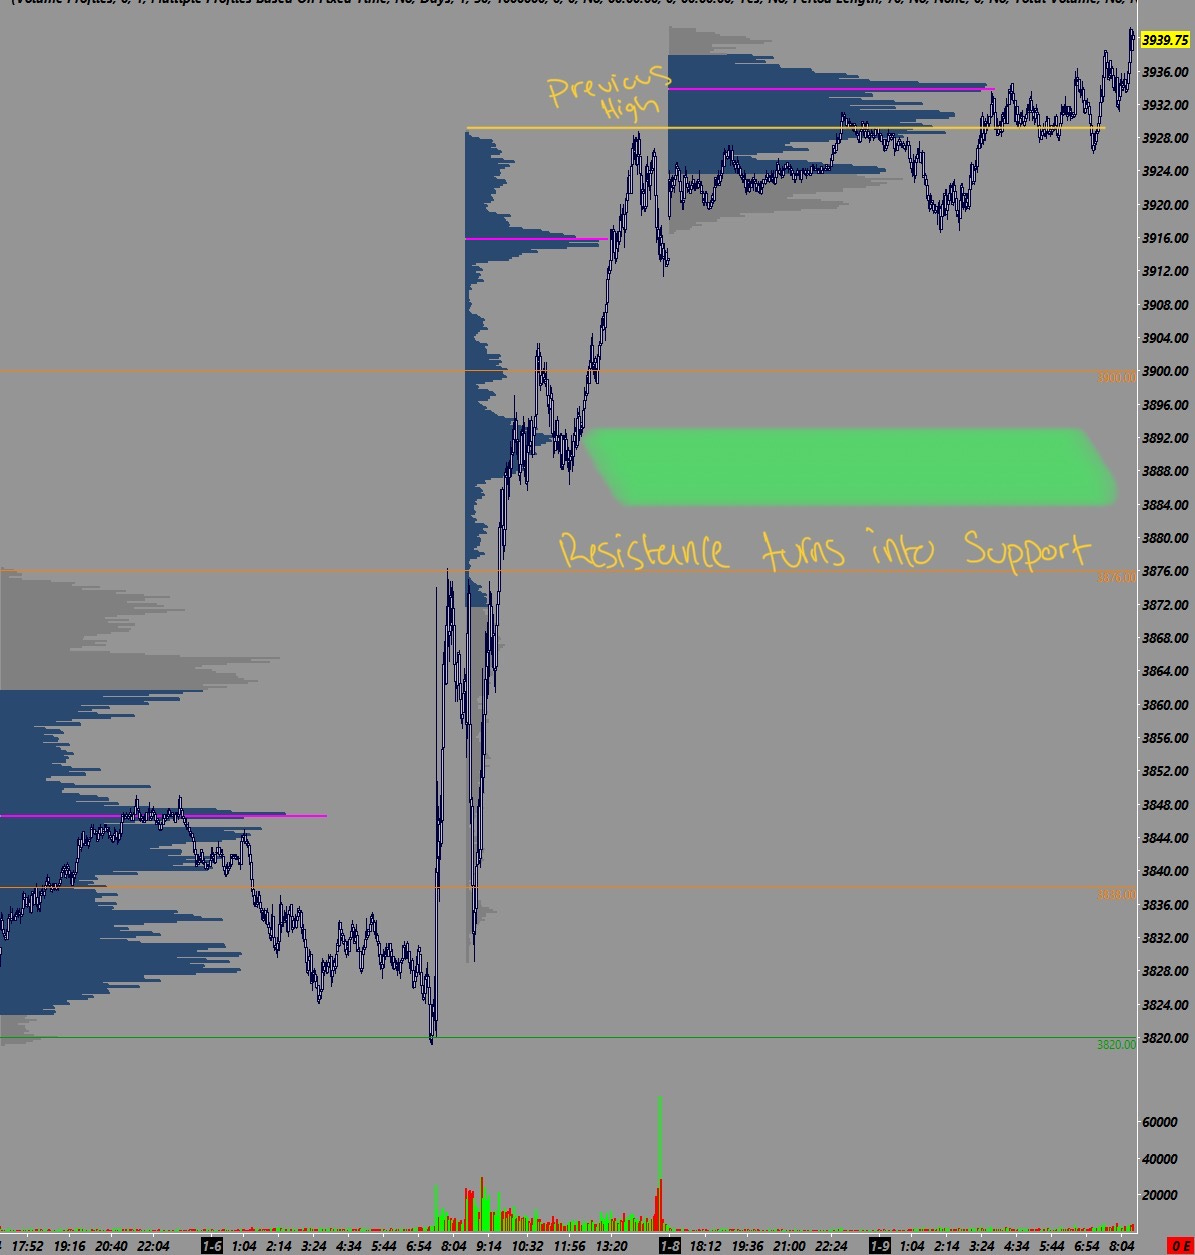
After the NFP report, we tested the daily resistance at 3930 then rocketed up to 3876 resistance. Now that we have traded back above 3938 pivot level, I am expecting that if we re-visit this area (I use a range from 3938 to 3950 which was the previous day high/obvious resistance) it should offer support which would then target pre-market highs and next identified resistance level at 3876.
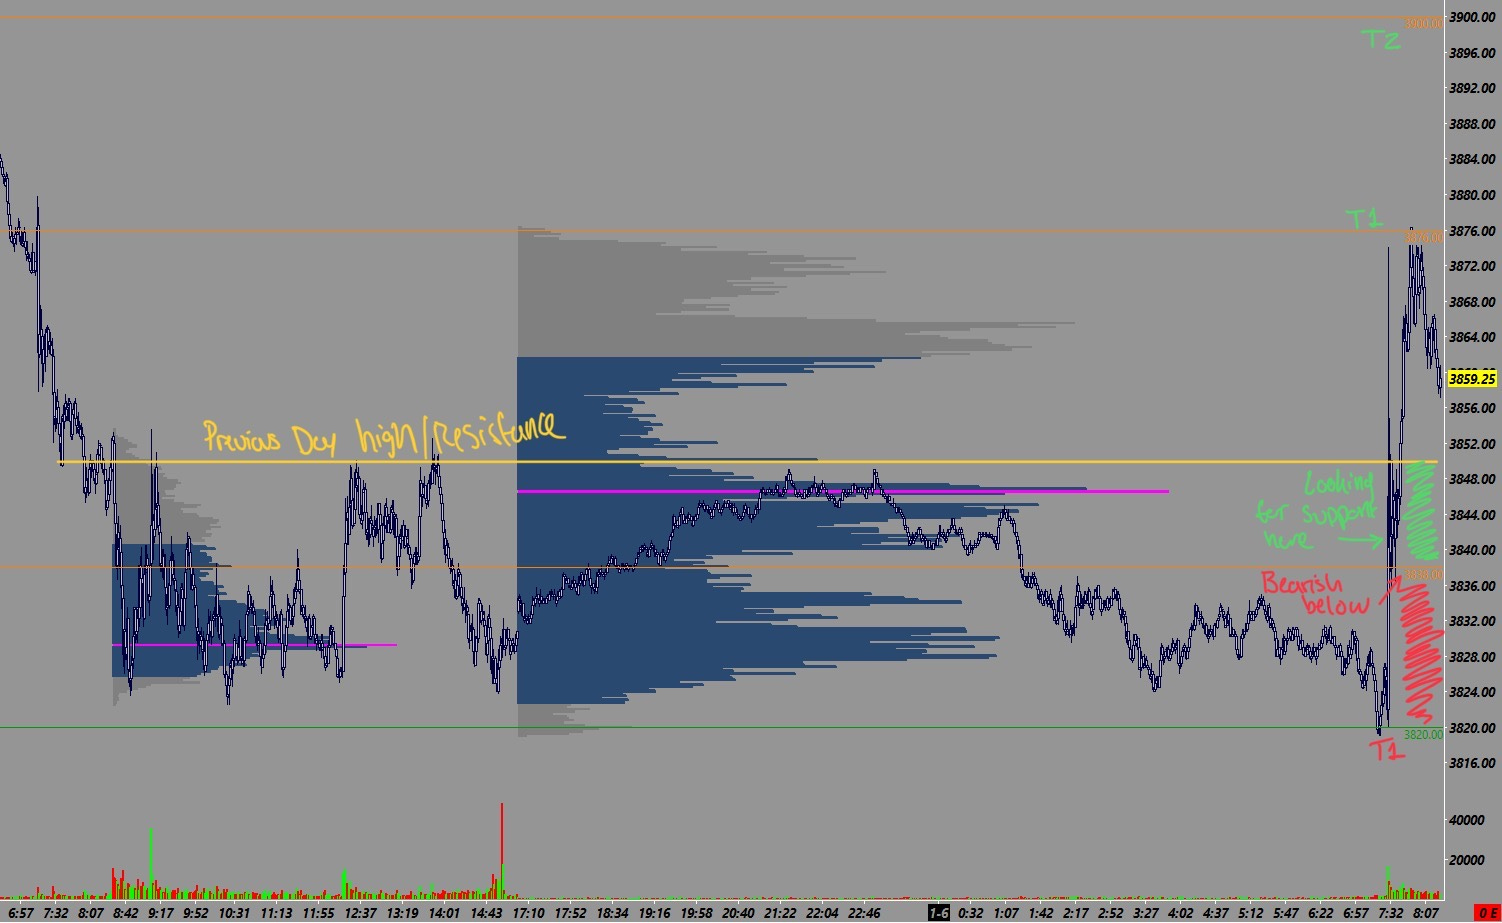
At the open of this session, we saw an immediate move down into 3938 support which held and offered a wonderful long opportunity. Following this bounce at support, the logical targets would be high of day/3876 resistance, and we know above this level the next resistance level is 3900.
There is also more than one way you could have traded these levels. You could have faded the open or waited until the breakout at 3876 to get long for 3900. It all depends on your trading style, but the levels remain constant.
At this point something important has happened that we need to zoom out to see
We have broken out from a multi-day resistance level at 3900.
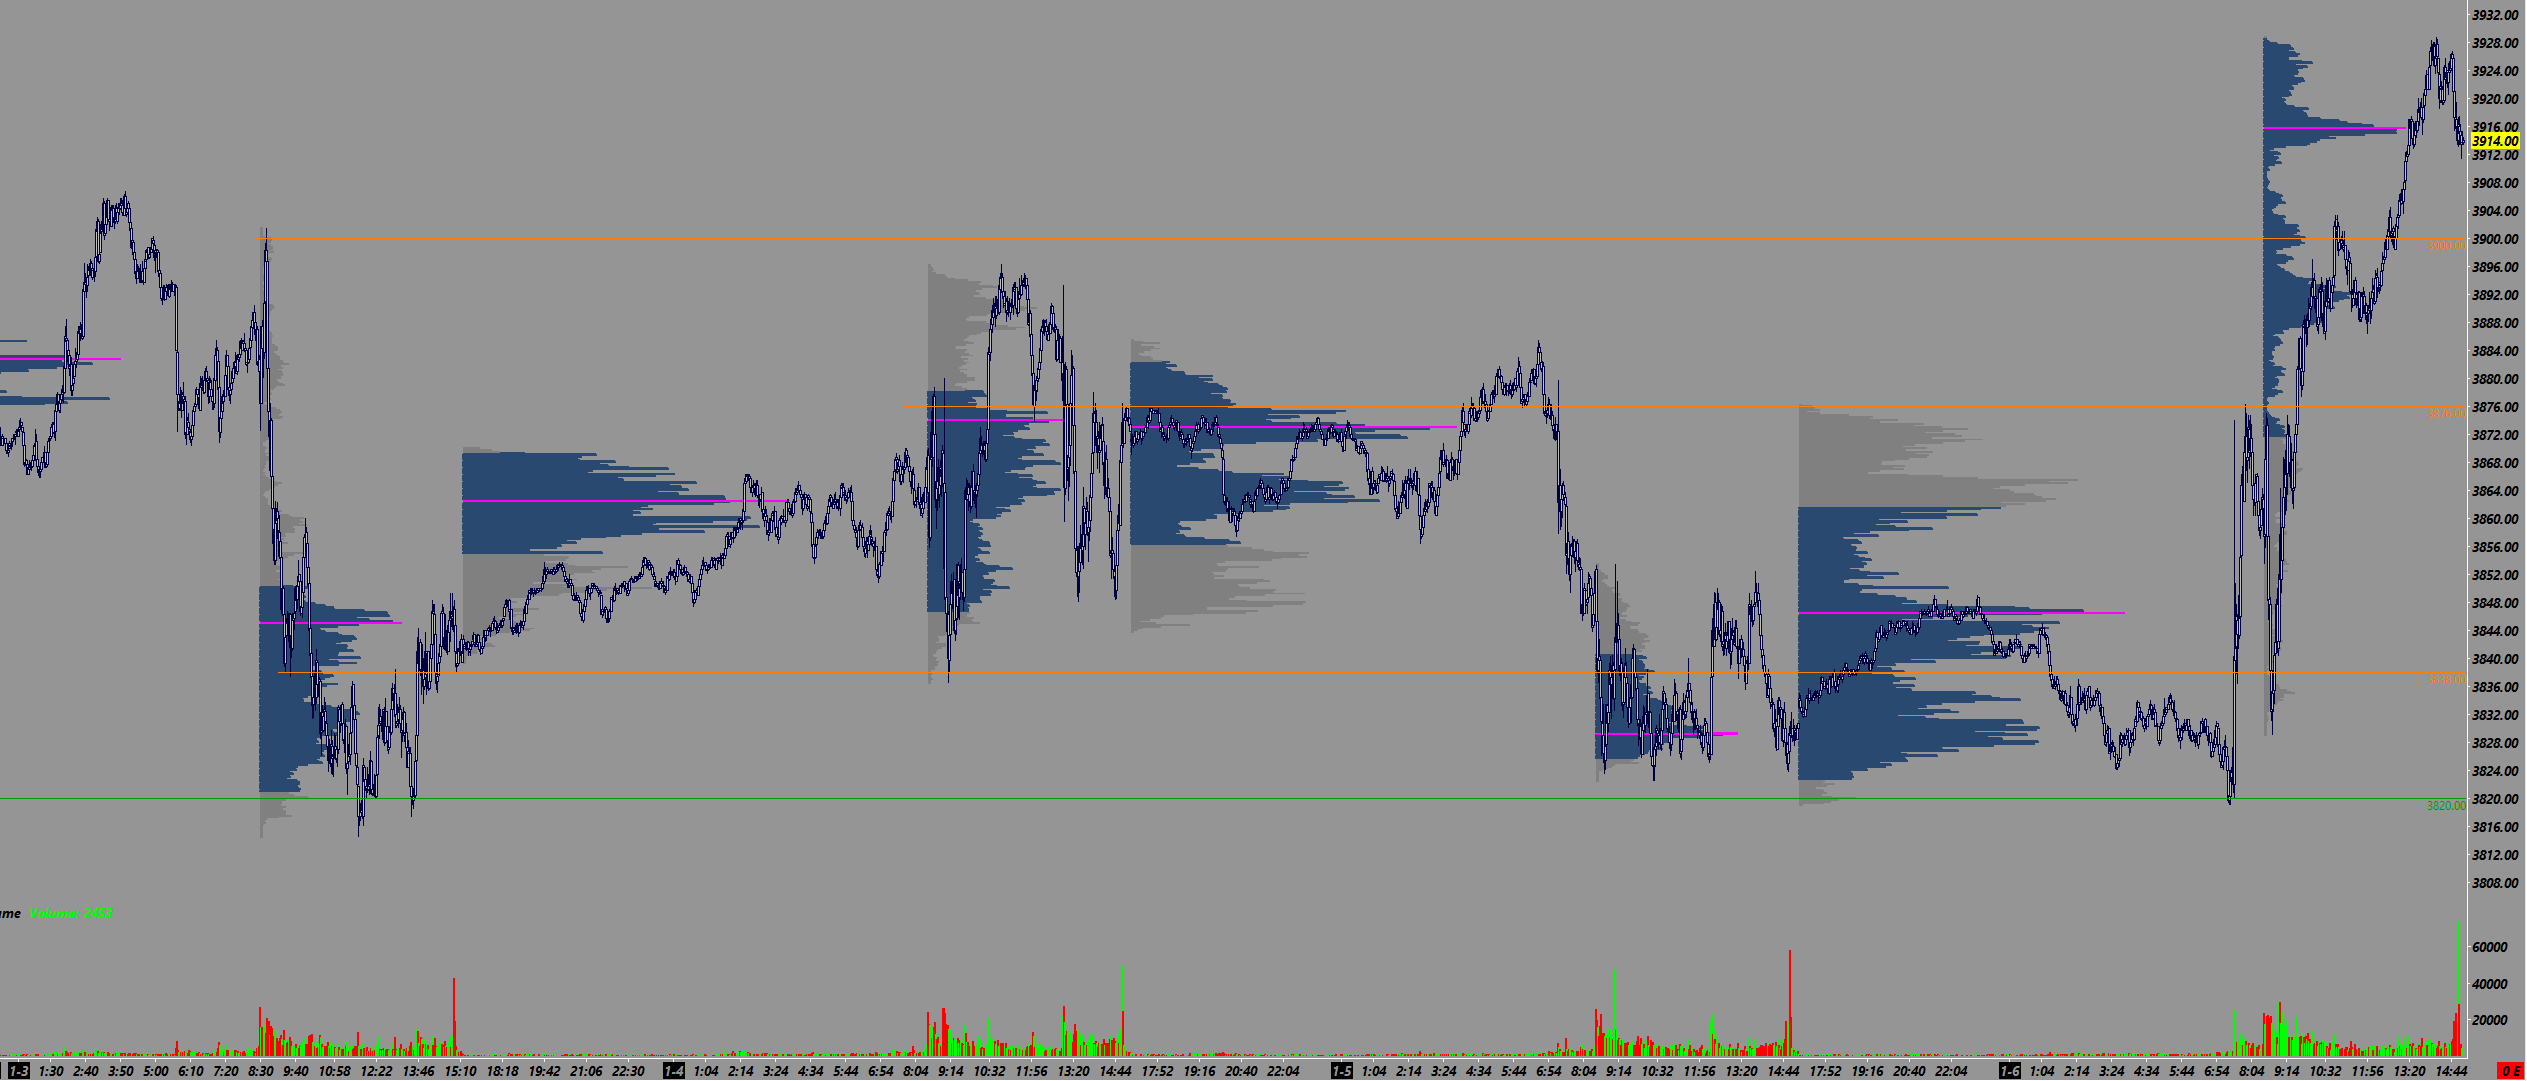
Lets recap what we have so far. We’ve identified the bottom of this range at 3820 and the top of the range at 3900. We have also identified two “minor” levels within this range at 3938 and 3876.
During the last session we saw a breakout above the top of this range at 3900.
The “origin” of the breakout was at 3876 resistance.
We’ve now got this 3876-3900 zone that acted as resistance before now serving as support below us.
Therefore my plan for the next day is to look to buy dips into this area to target the high from the breakout session at 3930 since this is our next identified level.
1/9/23
Here is my plan from the night of 1/8
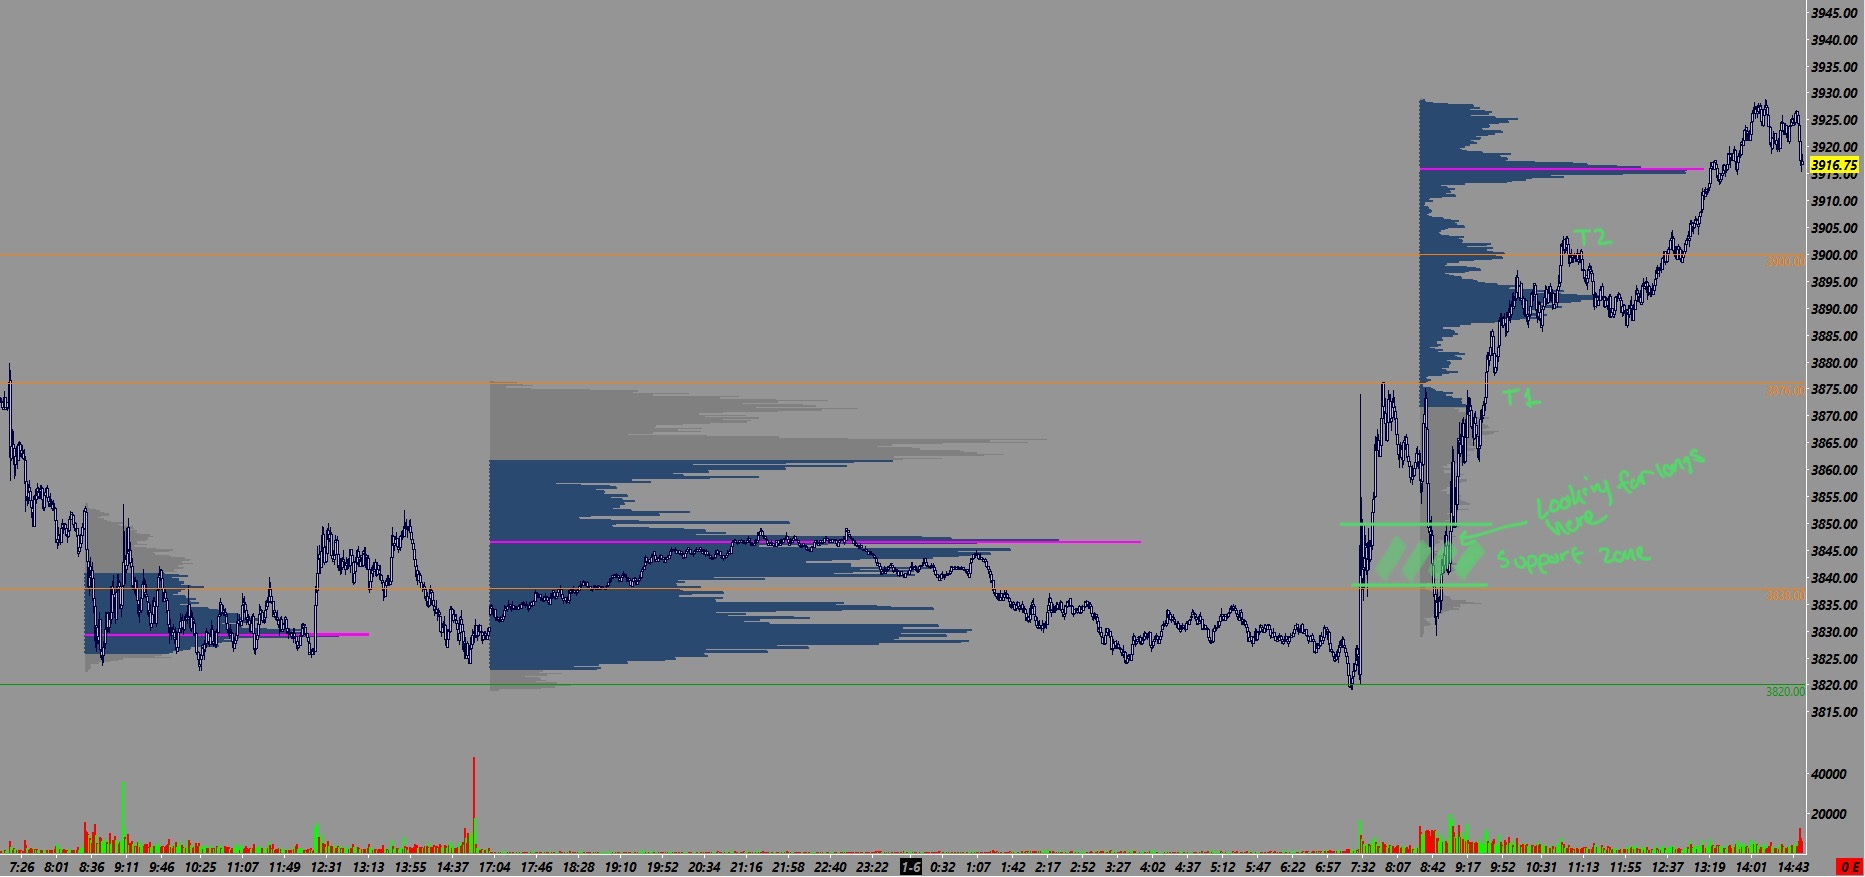
Following the breakout session on 1/6, the index remained supported above the breakout session high at 3930 nearing the US open.
A key reference I use following a trend day is the previous day high/low depending on the trend direction.
If we remain above previous day high following an up trend day, then the odds for trend continuation are greater than if we opened below the previous high.
There is alot to unpack from the session that followed.
Starting with the open, we opened on a gap above the previous day high, back tested the previous day high which held, then made a move to new highs above 3970.
My plan was to look to buy pullbacks into 3876-3900 but this did not come. That is okay things do not always play out according to the plan.
However, the market generated two new references for us before noon which could have been used to trade the afternoon session or could potentially have an impact on the next session.
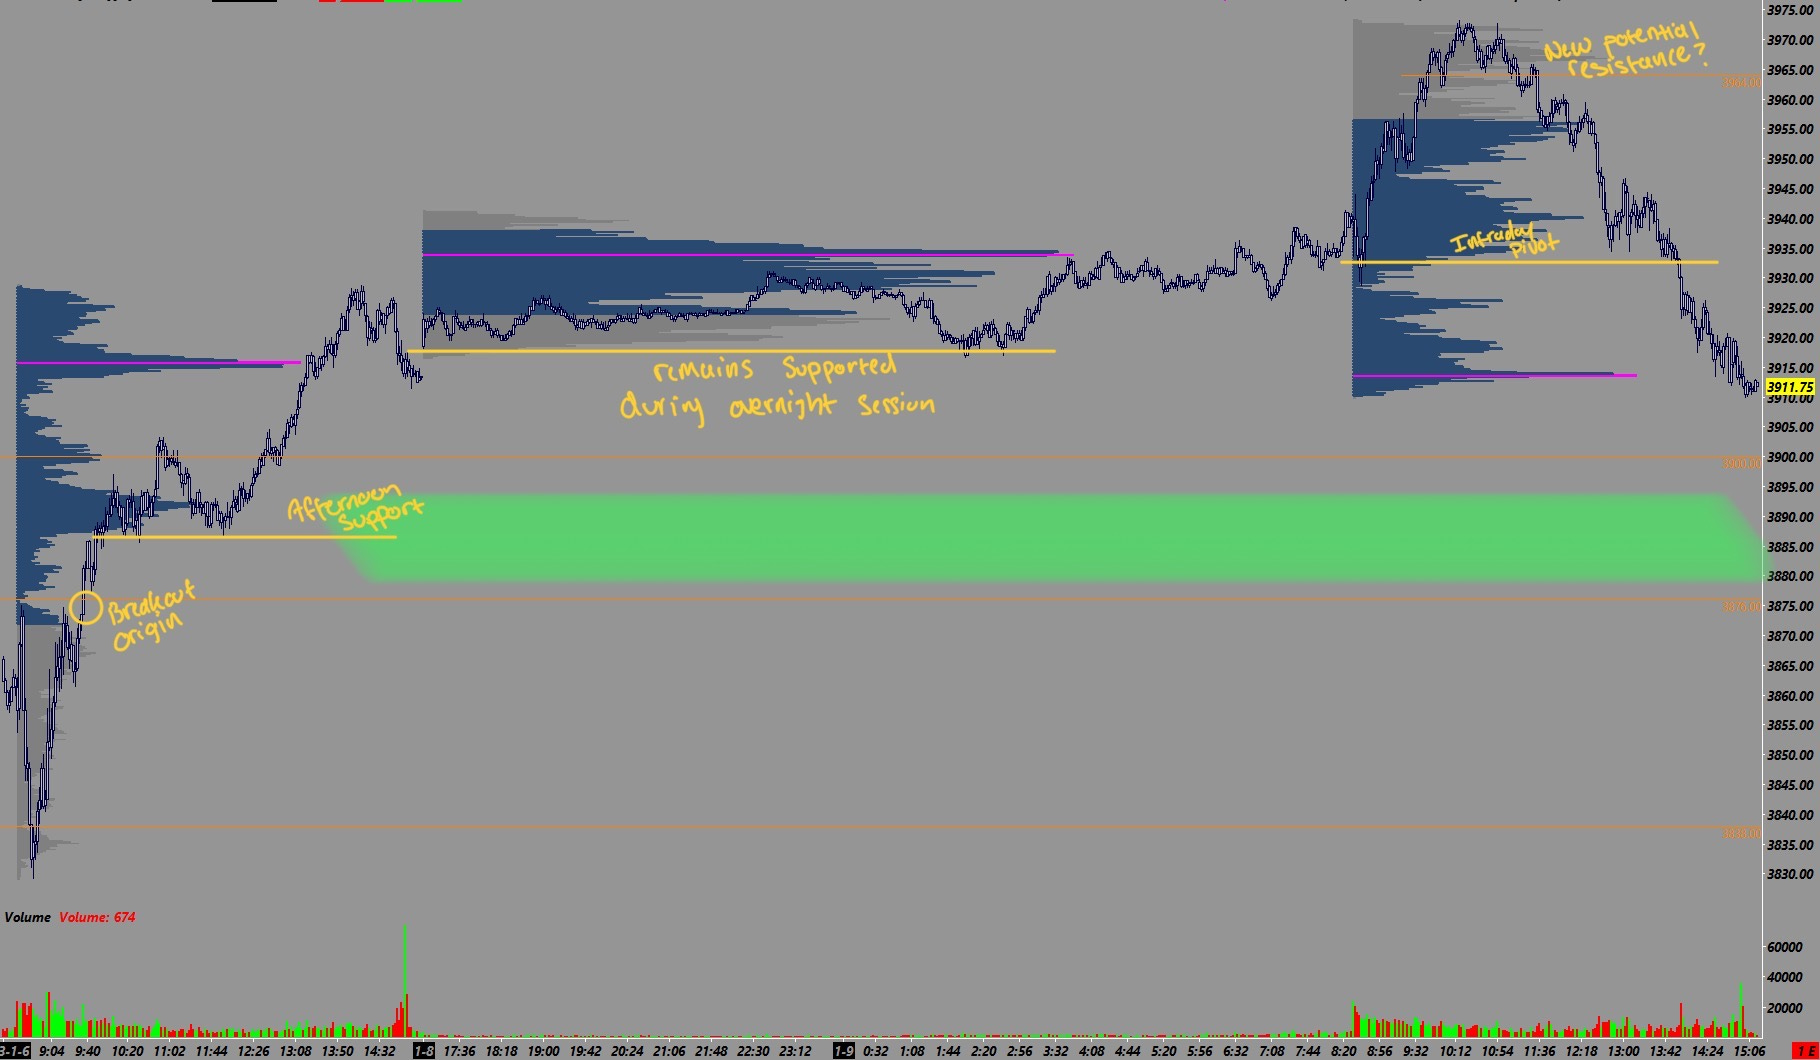
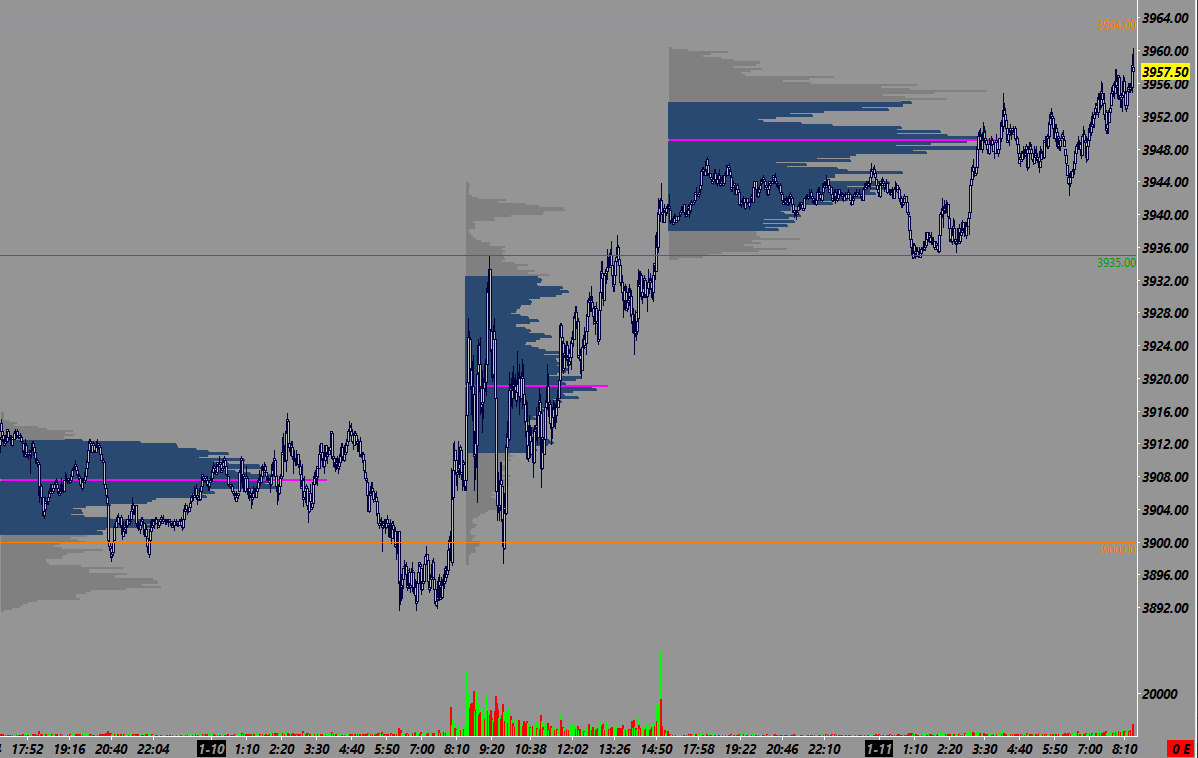
Once we tookout the support shelf built at 3950 early on in the session, momentum shifts and the trend rolls over.
In the short term my immediate target would be the low of day at 3930 because this is the next immediate reference.
However over the course of the next few hours or next session or two, I would think that since the breakout has failed we should re-test the “origin” level of the breakout to see if buyers stand ready to defend this support.
We also identified a potential new resistance level at 3964. The breakout from 3900 officially stalled out at this 3964 level, and once we rejected off this level we saw a 50+ point move to the downside. This level will definitely play a role if we are going to see continued upside.
1/10/23
Following 1/9, we have now sold-off from new highs following the breakout and are approaching the key support zone identified at 3876-3900.
I would be thinking that we ended yesterday with bearish momentum and I expect this bearish pressure to continue unless buyers overtake the intraday pivot identified yesterday at 3930/35 area.
Here is my plan for the 1/10 session
Leading up to the US open, we saw a very tight market that remained supported above 3900 and subdued below 3915.
This profile is neither bearish nor bullish in my opinion.
Notice the break below 3900 which was accumulated and bid back up before the open.
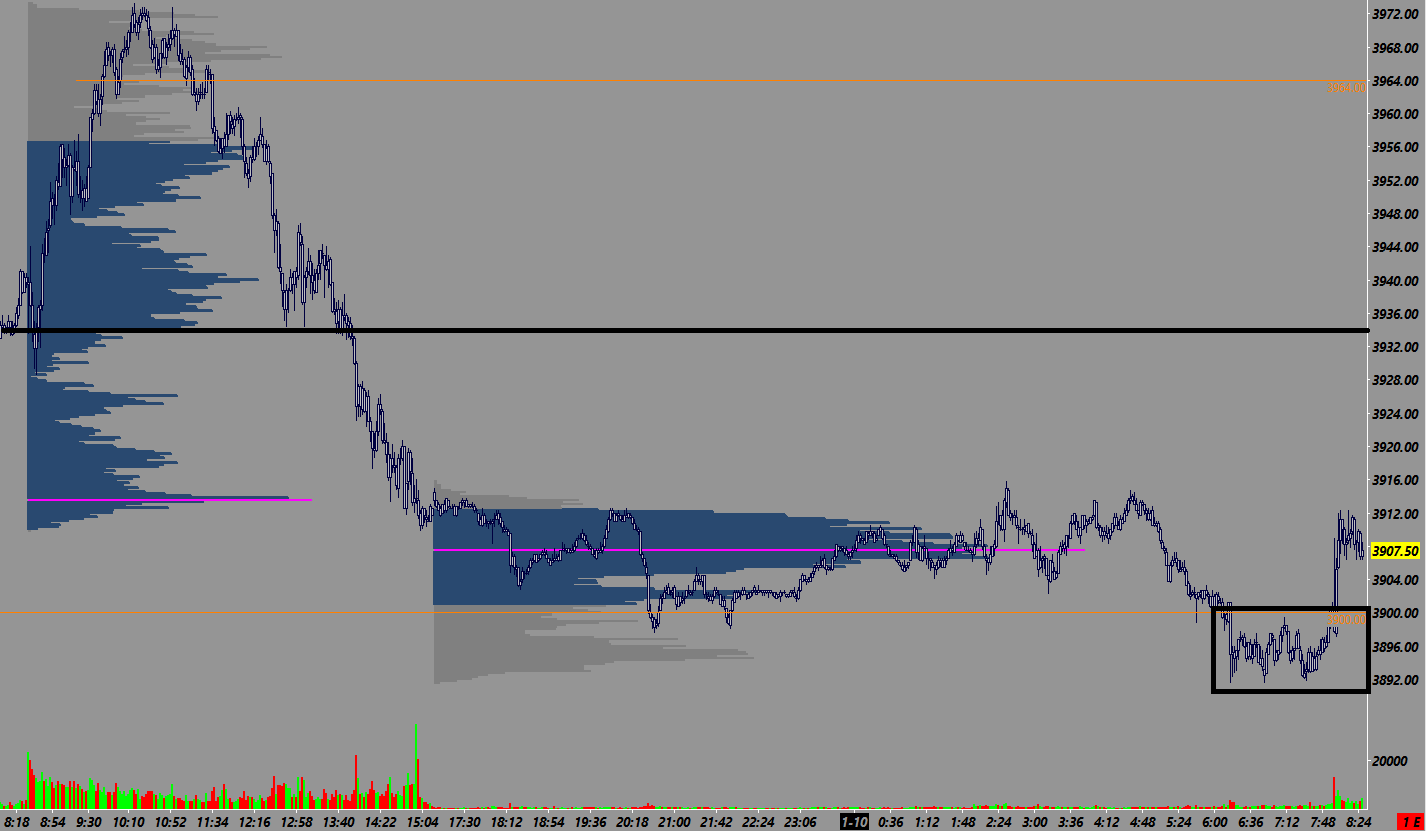
This looks bullish to me. The story this tells me is that price auctioned below support ("peaked below”) and found no sellers willing to take the market lower. This leads me to conclude that buyers are in control.
At this point I am leaning on 3900 support to look for longs targeting the pivot level identified from the previous session at 3930.
Once/if we get to 3930, that is when I would re-asses to determine if I think we can move higher to the next resistance at 3964, or rotate back down to 3876-3900 support.
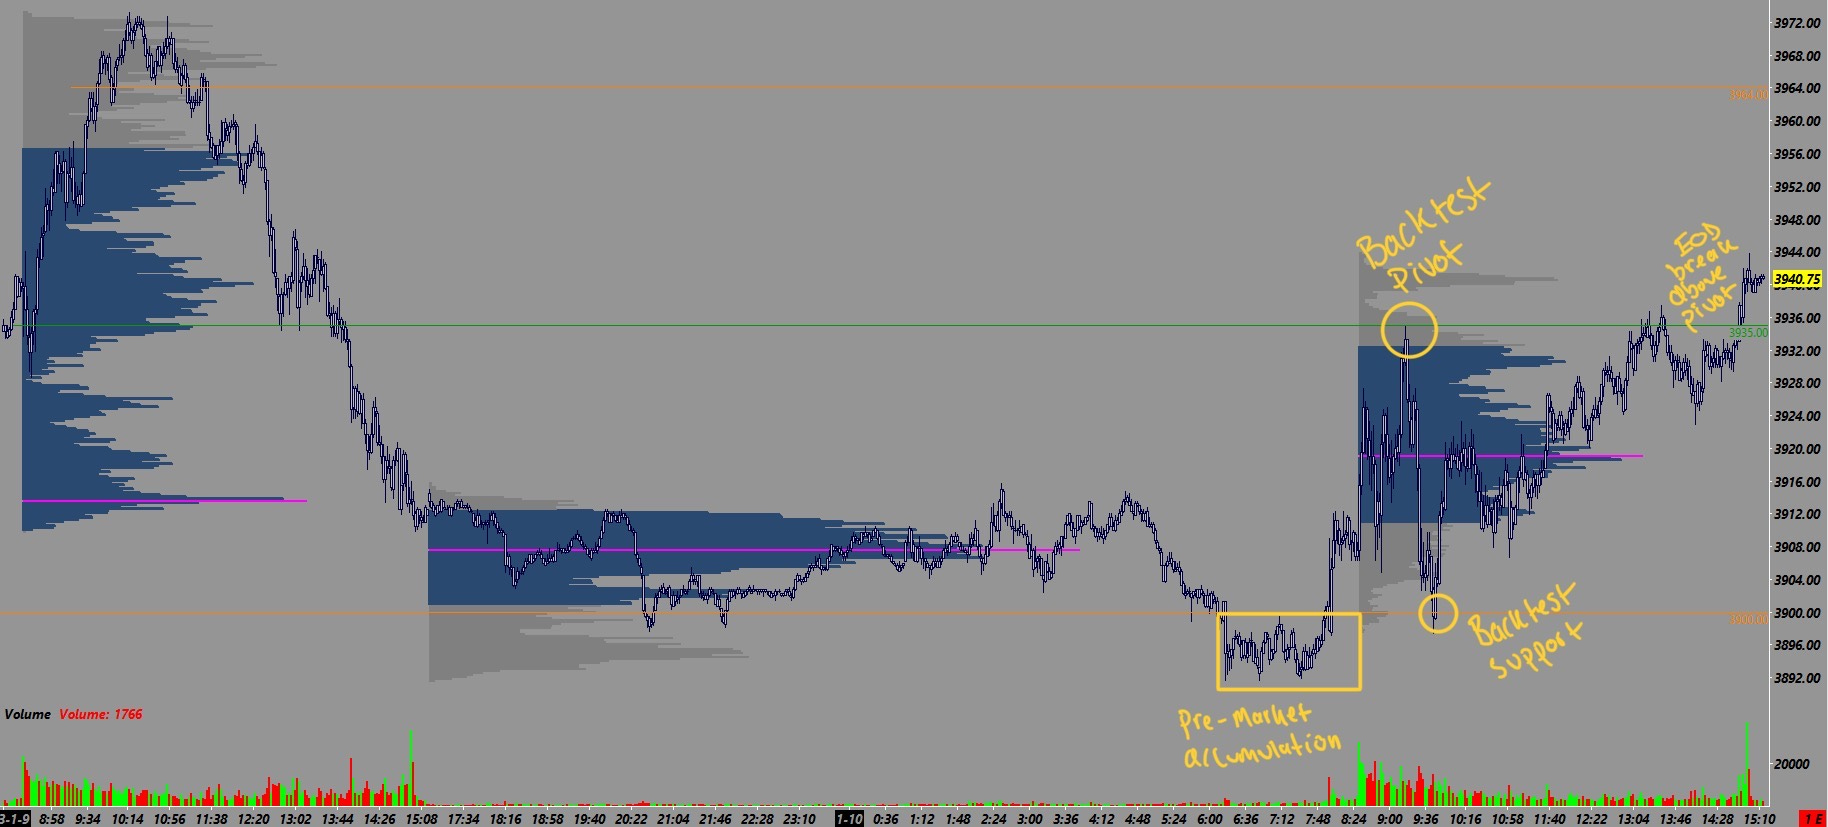
There is a good educational chunk to unpack from this profile as well.
Off the strength of support buyers at 3900, we did back test the pivot at 3935 identified for the session prior.
This move was rejected and we back tested support at 3900.
We then saw a grind higher to finish the session back above the pivot at 3935.
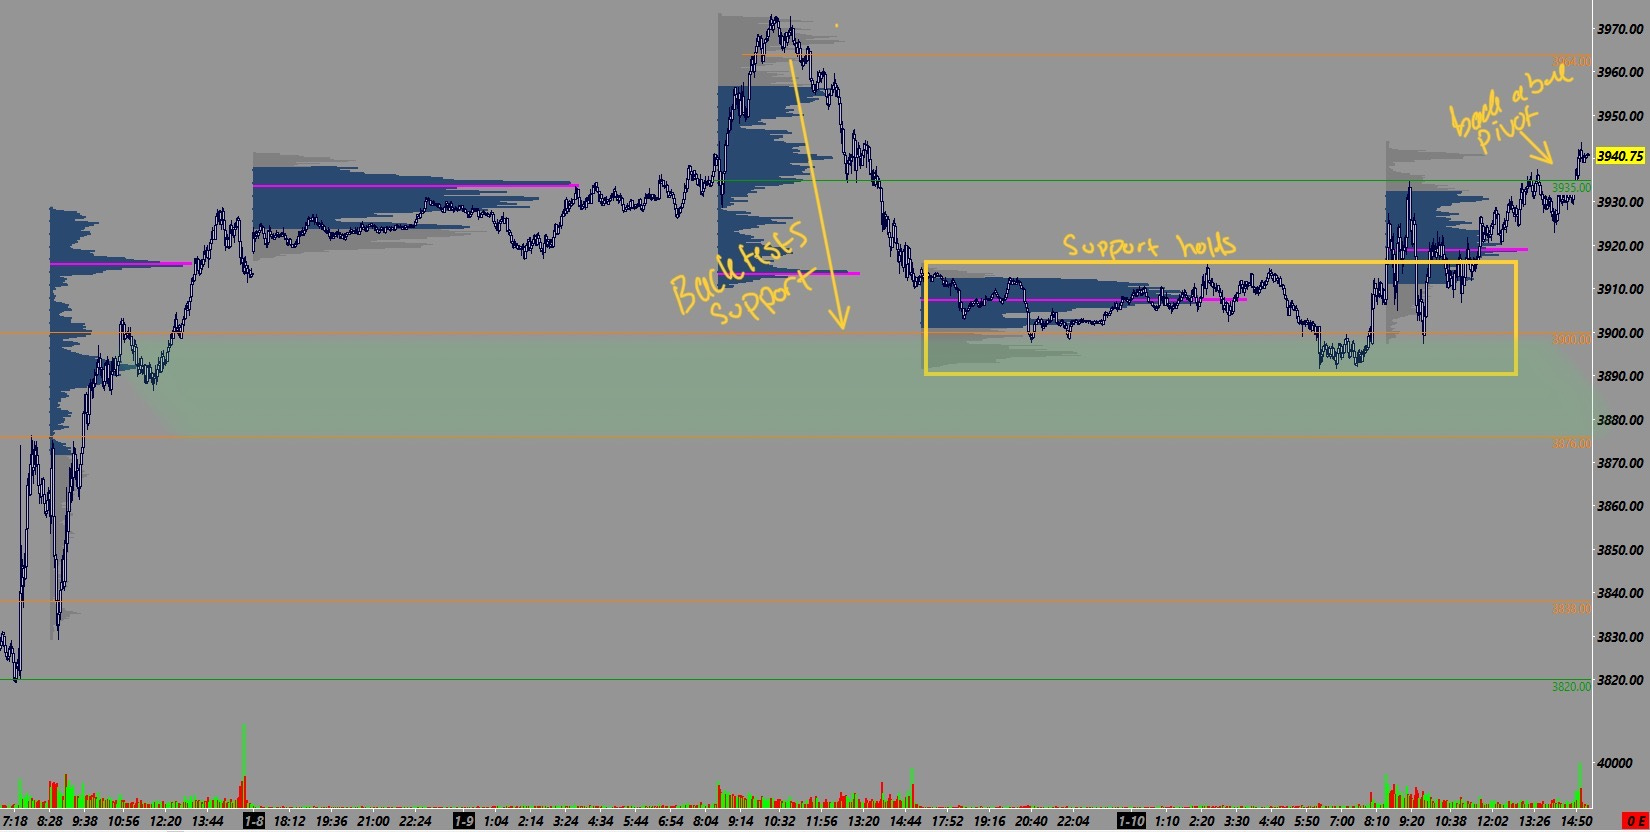
If we zoom back out to the multi-day time frame, we still remain supported above the support zone at 3876-3900.
We also finished the session with a fattened profile which itself is not outright bullish but lets put the pieces together.
We have broken out from prior resistance, identified a new resistance level above us at 3964, back tested old resistance now support at 3900 and held, and closed the session back above the pivot identified from the session prior.
This is a confluence of bullish factors and I expect if we remain above this 3935 level into the next session we should look to revisit that newly identified resistance level at 3964.
And I would be thinking if we do not hold above this 3935 pivot level tomorrow morning, then we could fall back down to the next reference which is the value area low at 3910 and support at 3900.
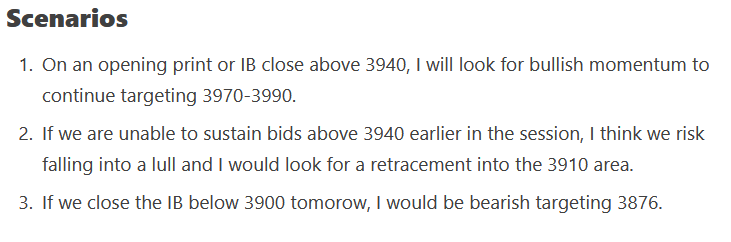
This is my actual plan shared on this day:
1/11/23
Leading up to the US open, we saw the overnight session remain supported above 3935 and we inched up towards that newly identified resistance level at 3964.
At this point for me, we are opening quite far above identified support at 3935 and quite close to resistance at 3964.
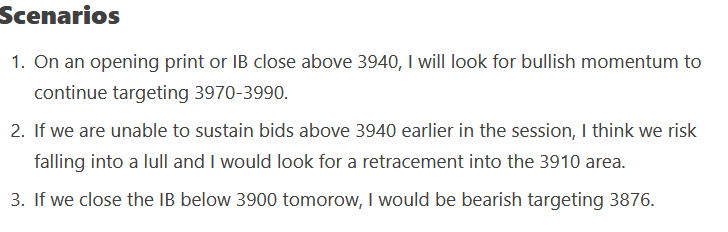
At this point I would be looking for a few set-ups:
a) Buyers take 3964 and hold above this level to break higher to the next resistance which in this course has yet to be identified.
b) Buyers test 3964 and find resistance which could then target the next reference which is the gap fill from yesterday at 3940.
c) We open and fall to 3936 which could act as support for a move to newly identified resistance at 3964
There are infinite ways this could play out but nothing changes the fact that we should expect 3964 to act as resistance until broken and 3935 to act as support until broken.
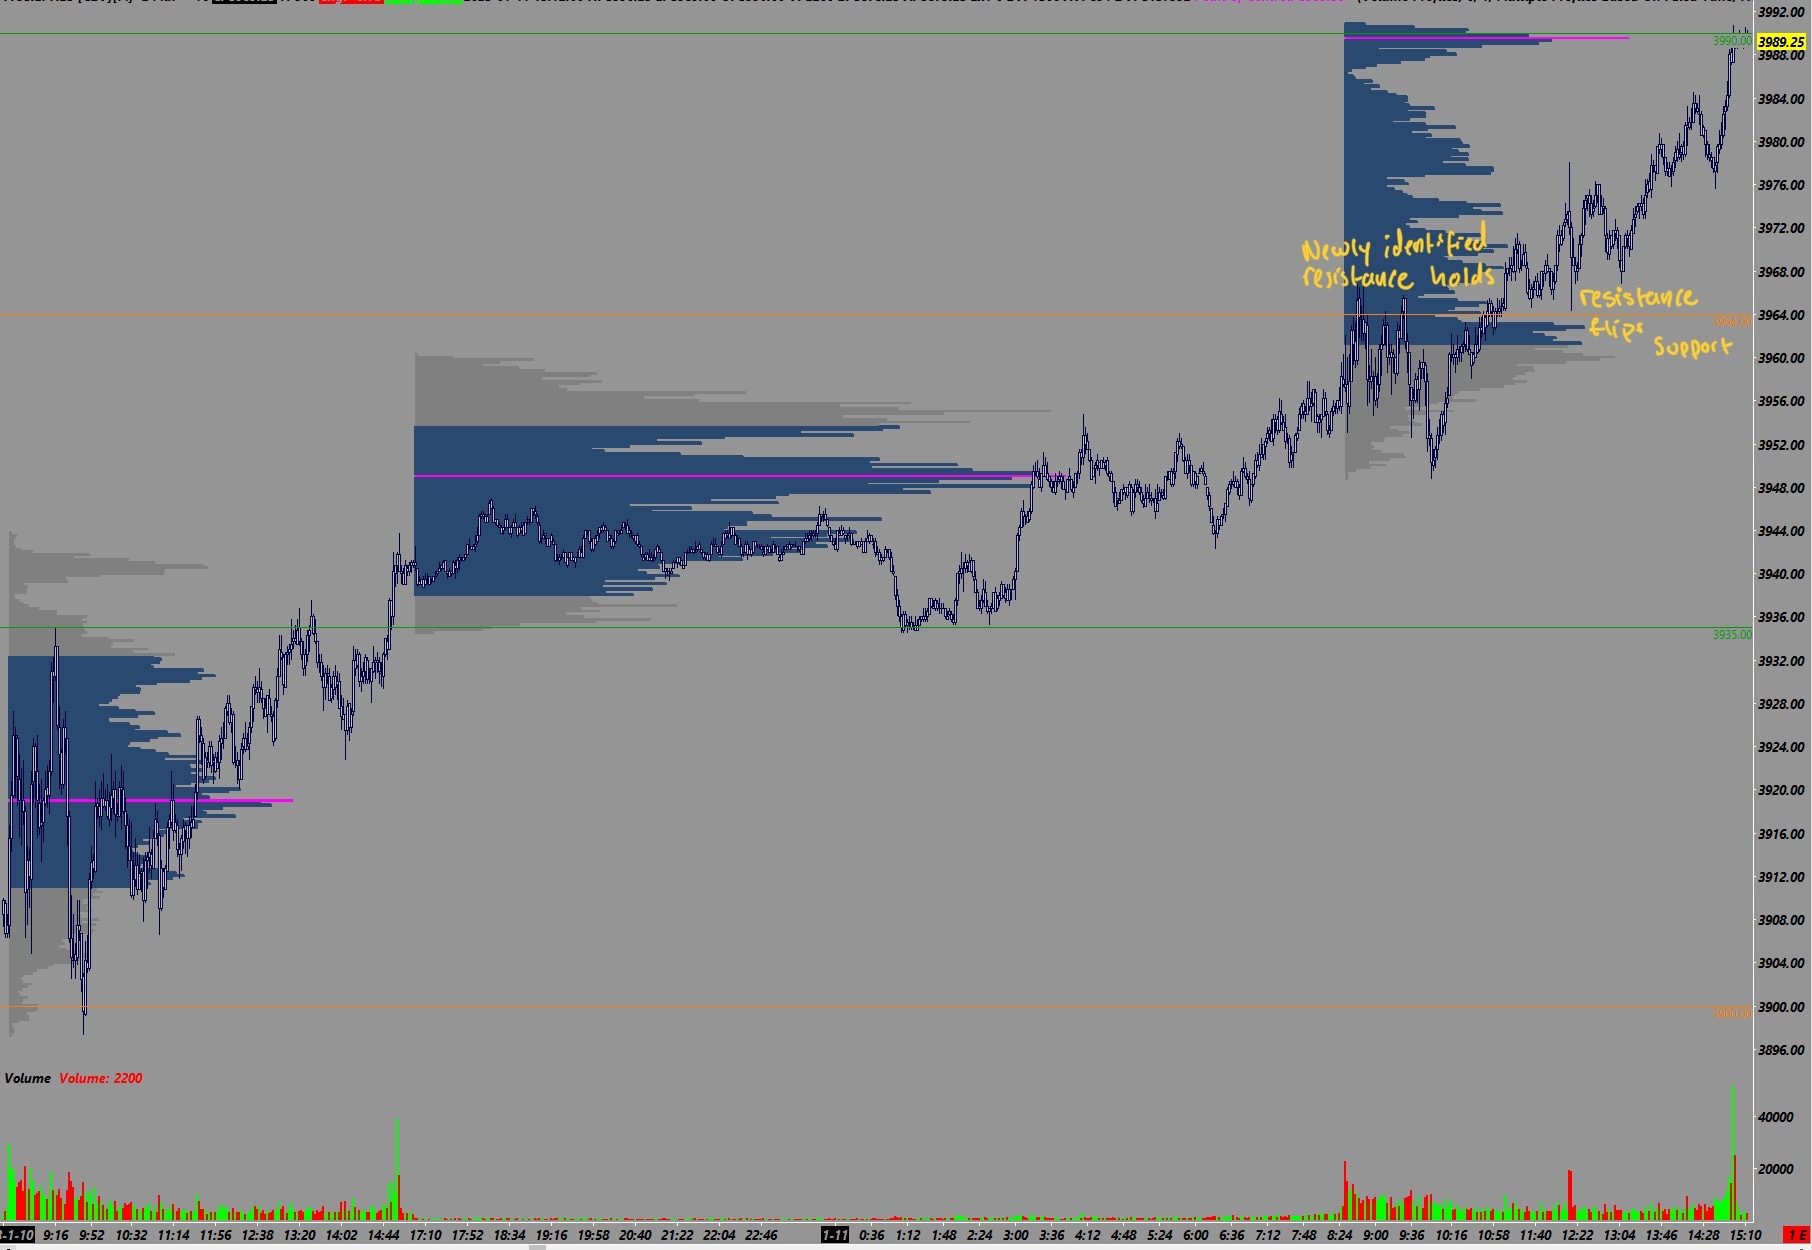
Newly identified resistance at 3964 played a key role during this session.
As you can see on the chart above, this level acted as resistance in the morning then flipped support once overtaken in the late morning session.
Once 3964 flipped support in the afternoon the next upside target did not come until 3990. We have not visited 3990 during this exercise so we would have known this to be the next resistance level. In reality however, we knew that this was the next resistance level and that is why it was the target per scenario #1 on this day
1/12/23
… To be continued
If you found this useful please let me know below so that I know to continue with content like this
So freaking helpful man!!! This is an eye opener. Please do more of these. Much appreciated!!
great tutorial!